Wave Analysis 14.04.2014 (DJIA Index, Crude Oil)
14.04.2014
Analysis for April 14th, 2014
DJIA Index
It looks like Index completed correction in the form of double three pattern inside wave [2]. Earlier price formed bullish impulse inside wave [1]. During the day, instrument may start growing up again and form initial ascending impulse.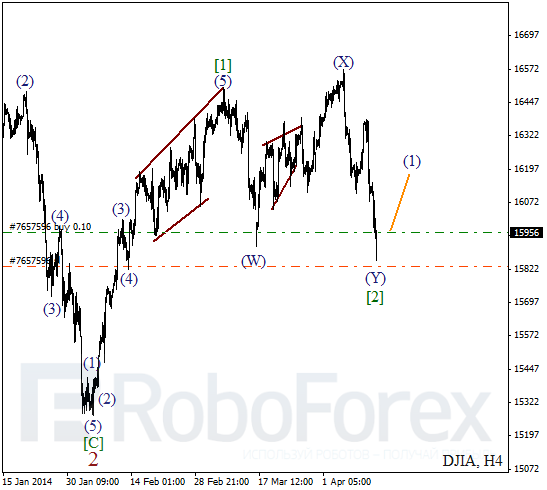
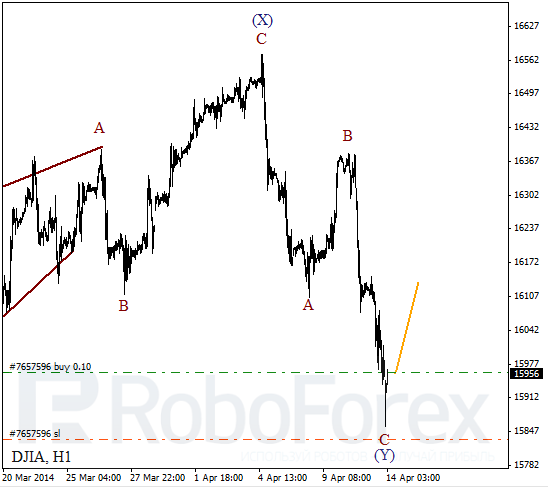
More detailed wave structure is shown on H1 chart. It looks like price formed zigzag pattern inside wave (Y). On minor wave level, Index completed impulse inside wave C, which means that instrument may reverse quite soon.
Crude Oil
Oil is trying to start fast descending movement inside the third wave. Several weeks earlier, Oil finished bearish impulse inside wave 1 and then completed wave 2. I’m planning to increase my short position as soon as market starts moving downwards.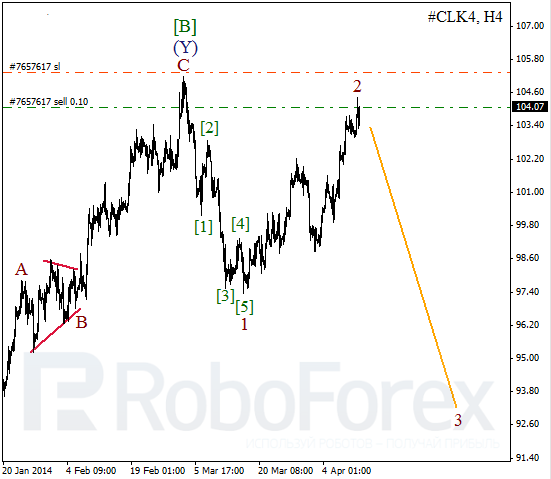
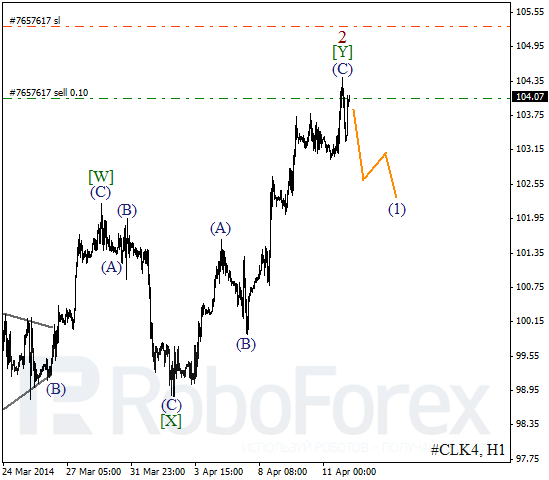
As we can see at the H1 chart, Oil completed zigzag pattern inside wave [Y] of 2. On minor wave level, price is starting to form bearish inside wave (1). I’ll move stop into the black as soon as market starts moving downwards.
RoboForex Analytical Department
Attention!
Forecasts presented in this section only reflect the author’s private opinion and should not be considered as guidance for trading. RoboForex bears no responsibility for trading results based on trading recommendations described in these analytical reviews.