Wave Analysis 11.04.2013 (DJIA Index, Crude Oil)
11.04.2013
Analysis for April 11th, 2013
DJIA Index
The Index continues moving upwards. It looks like the price is forming the fifth wave. During a correction, I opened a short-term buy order (Take Profit on my yesterday’s order worked). Most likely, in the nearest future the instrument will reach new historic maximums.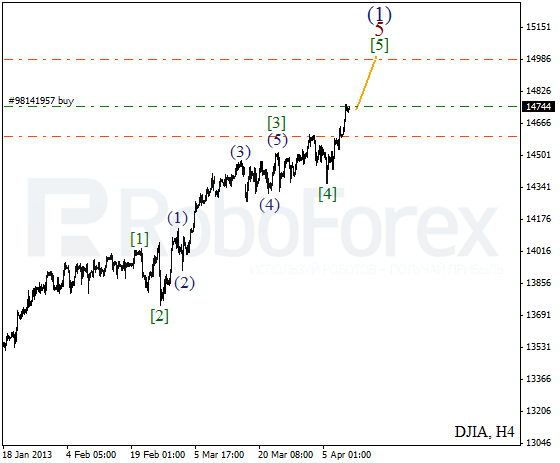
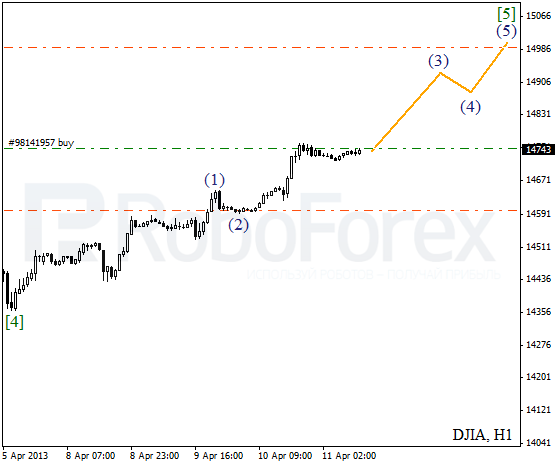
More detailed wave structure is shown on the H1 chart. It looks like the price is forming wave (3). During the day, I expect the market start a new ascending movement. If it happens, I’ll move the stop into the black.
Crude Oil
We may assume that the instrument is still forming triangle pattern inside wave B. On the minor wave level, the price is being corrected inside wave [E]. The market may start a new descending movement during the next several days.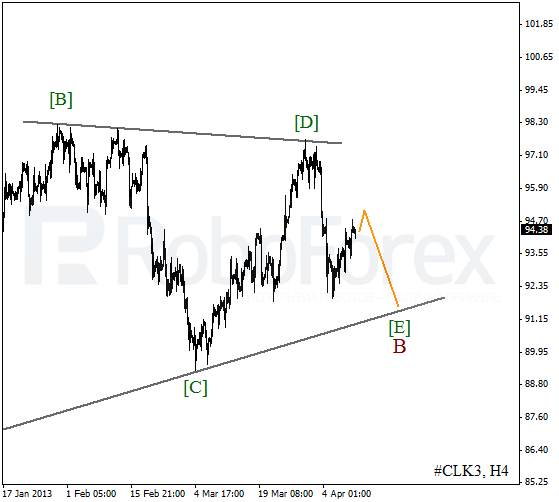
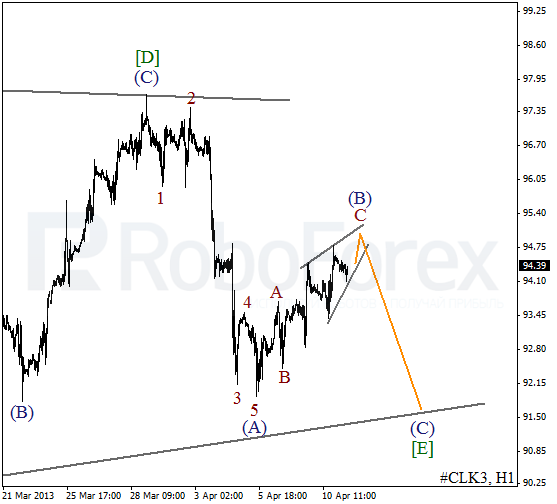
As we can see at the H1 chart, wave (B) is taking the form of zigzag pattern. Earlier the instrument completed a descending impulse inside wave (A). Most likely, after finishing diagonal triangle pattern inside wave C, the price will start a new descending movement.
RoboForex Analytical Department
Attention!
Forecasts presented in this section only reflect the author’s private opinion and should not be considered as guidance for trading. RoboForex bears no responsibility for trading results based on trading recommendations described in these analytical reviews.