Wave Analysis 02.04.2013 (DJIA Index, Crude Oil)
02.04.2013
Analysis for April 2nd, 2013
DJIA Index
The Index is forming an ascending impulse inside wave [5] of 5. The current wave structure implies that the instrument may yet continue growing up for a while, but the bulls are very unlikely to be able to push the price too high. In my opinion, there is a strong possibility of a new correction, that’s why right now I’m opening only short-term orders.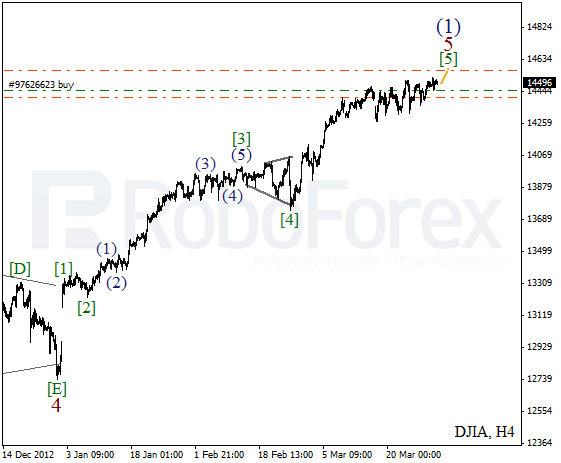
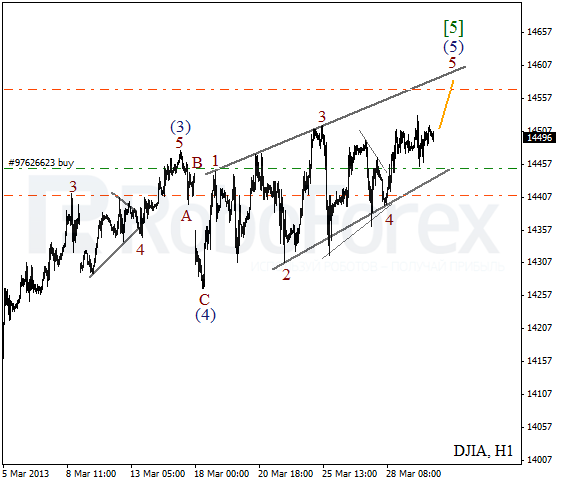
As we can see at the H1 chart, the price is forming diagonal triangle pattern inside wave (5). On the minor wave level the Index is forming the fifth wave. Most likely, the Index will reach a new historic maximum during the day. Take Profit on my buy order is placed a bit lower that the pattern’s upper border.
Crude Oil
After completing horizontal triangle pattern inside wave B, Oil is forming a bullish impulse inside wave [1]. Most likely, the price will continue growing up in the nearest future. Later, in my opinion, the instrument may start a correction, after which the bulls are expected to start pushing the price upwards inside the third wave.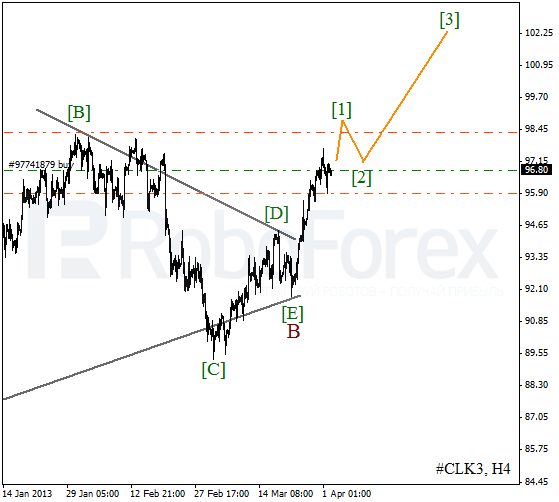
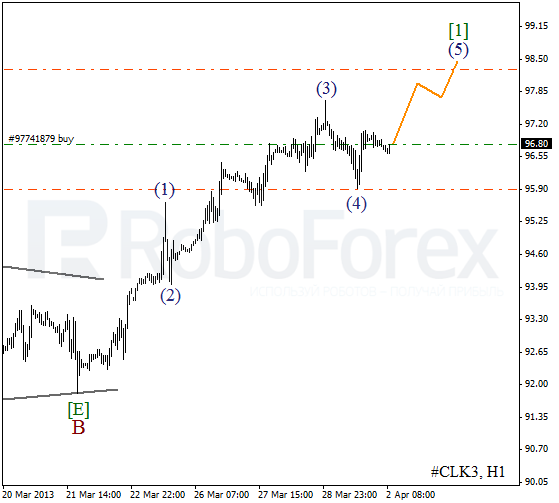
More detailed wave structure is shown on the H1 chart. Yesterday the price completed the fourth wave inside wave [1]. It looks like the instrument is going to break a local maximum during the day while forming the fifth wave.
RoboForex Analytical Department
Attention!
Forecasts presented in this section only reflect the author’s private opinion and should not be considered as guidance for trading. RoboForex bears no responsibility for trading results based on trading recommendations described in these analytical reviews.