Wave Analysis 28.03.2014 (DJIA Index, Crude Oil)
28.03.2014
Analysis for March 28th, 2014
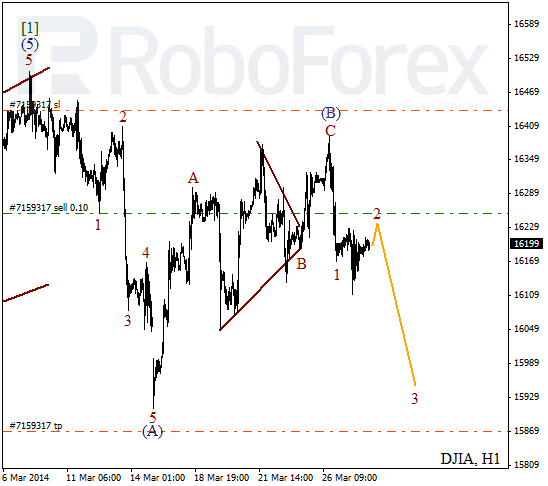
DJIA Index
Index is still being corrected. It looks like wave [2] is taking the form of zigzag pattern. In the near term, instrument is expected to continue falling down inside wave (C) and break local minimum.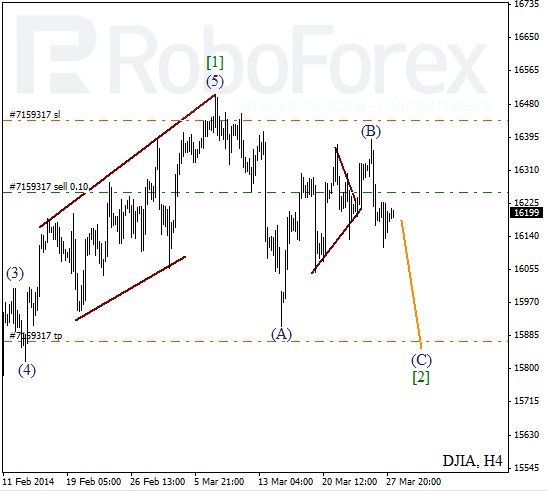
More detailed wave structure is shown on H1 chart. Probably, price formed bearish impulse inside wave 1 and right now instrument is being corrected inside the second one, which is taking the form of flat pattern. Most likely, price may start falling down inside the third wave during the day.
Crude Oil
Wave 2 is being formed much faster that I expected. Earlier Take Profit on my buy order worked and right now I’m staying out of the market. I’ll consider opening new sell order as soon as Oil forms initial descending impulse.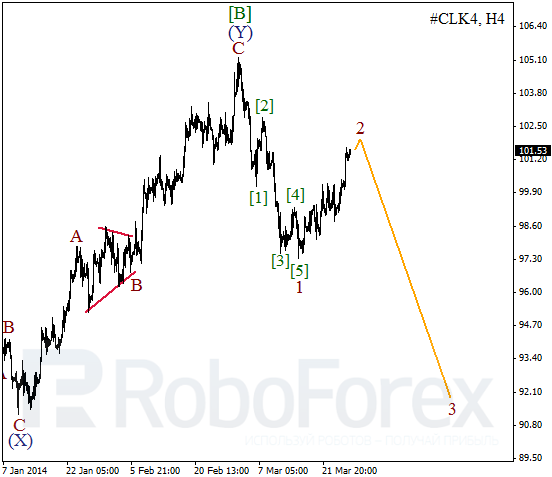
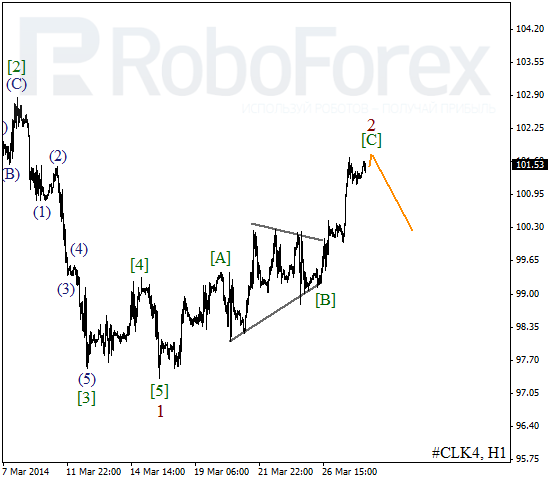
As we can see at the H1 chart, Oil formed horizontal triangle pattern inside wave [B]. Right now, price is forming bullish impulse inside wave [C] with the fifth wave being completed inside it. Possibly, instrument may reverse downwards during Friday.
RoboForex Analytical Department
Attention!
Forecasts presented in this section only reflect the author’s private opinion and should not be considered as guidance for trading. RoboForex bears no responsibility for trading results based on trading recommendations described in these analytical reviews.