Wave Analysis 23.03.2012 (NZD/USD, EUR/USD)
23.03.2012
Analysis for March 23rd, 2012
NZD/USD
It looks like wave [2] has been completed in the form of zigzag pattern. On Thursday the price grew up several pips higher than the minimum of wave[1], however, then the local correction started. Most likely, the pair will continue moving downwards in wave (1) during Friday.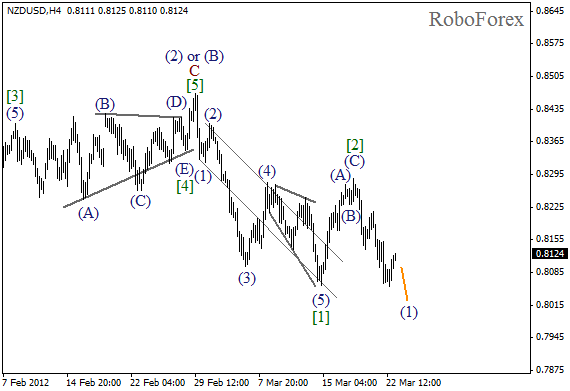
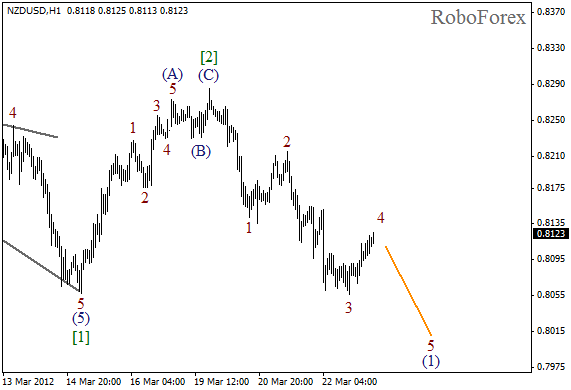
If we take a look at more detailed wave structure, which is shown on the H1 chart, we can see that wave 3 was completed yesterday, and right now the market is forming the fourth one. In the near term, we can expect the correction to be finished and the price to start falling down in wave 5 of (1).
EUR/USD
Upon the completion of wedge pattern in wave (1), the correction started, which has already been finished in the form of a usual zigzag pattern. At the moment the market is in the very beginning of wave (3). The price may reach a new local minimum the next week.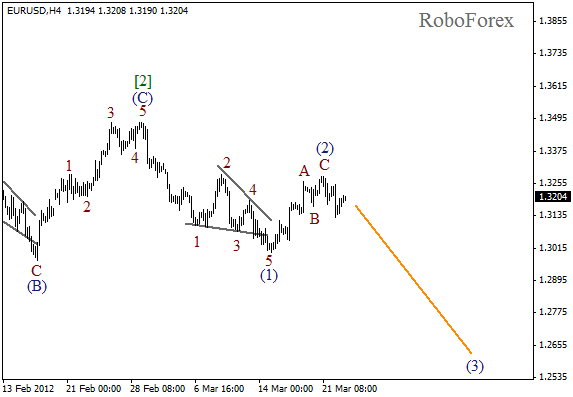
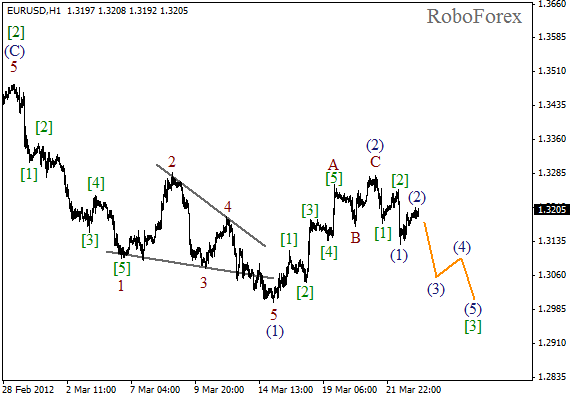
At the H1 chart wave structure is clearly seen, and we may assume that wave C is much shorter than wave A. It looks like the price is starting the formation of an extension in wave [3]. Euro may start falling down while forming wave (3) of Friday.
Attention!
Forecasts presented in this section only reflect the author’s private opinion and should not be considered as guidance for trading. RoboForex bears no responsibility for trading results based on trading recommendations described in these analytical reviews.