Wave Analysis 28.01.2013 (DJIA Index, Crude Oil)
28.01.2013
Analysis for January 28th, 2013
DJIA Index
The current chart structure implies that the Index may have already completed zigzag pattern inside diagonal triangle pattern of wave 5. In the near term, the market is expected to start a new descending movement.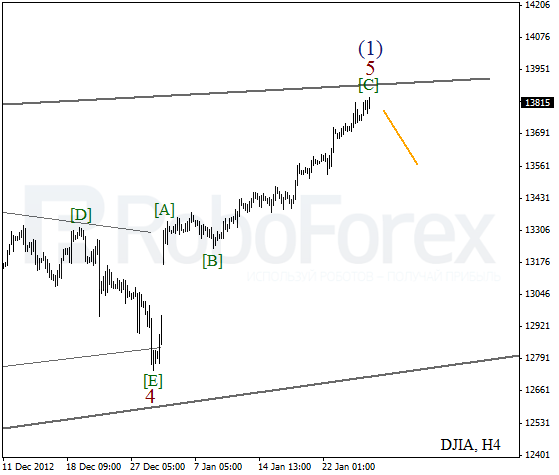
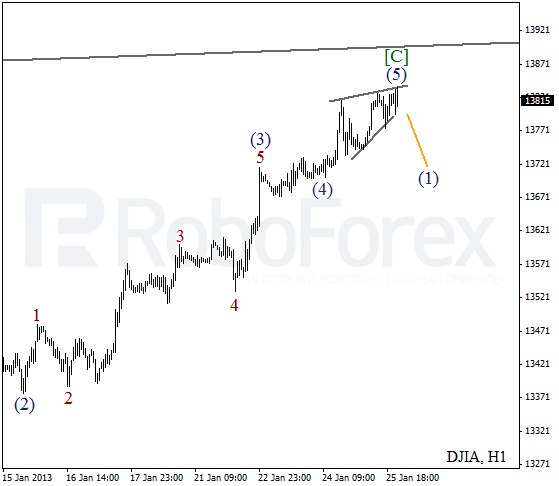
More detailed wave structure is shown on the H1 chart. We may assume that wave (5) took the form of diagonal triangle pattern. If the assumption is correct we can expect the Index to start forming a new initial descending wave.
Crude Oil
We can’t exclude a possibility that Oil has already completed an ascending impulse inside wave C. On the minor wave level the price is forming an initial bearish wave. In the near term, the instrument may start a new descending movement.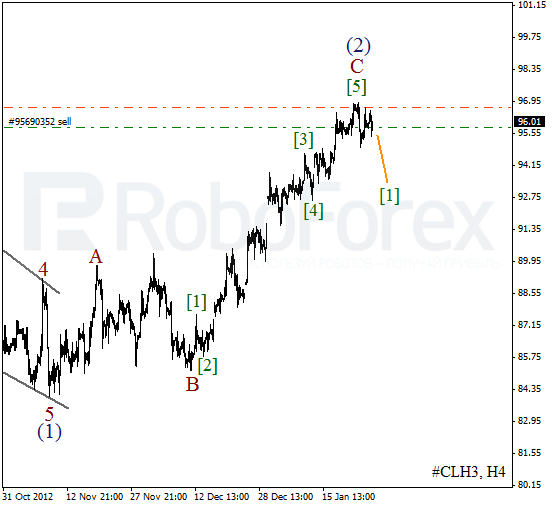
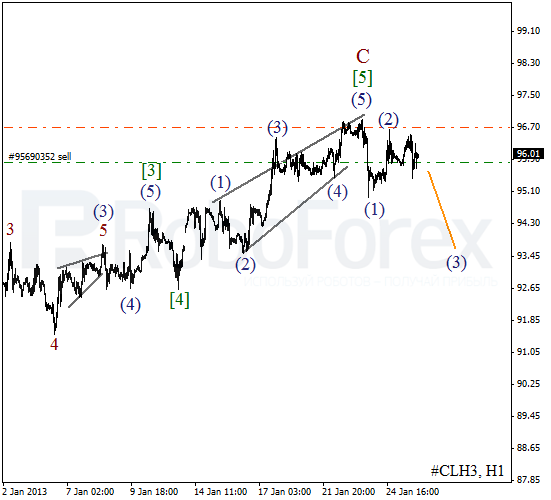
As we can see at the H1 chart, wave [5] was finished in the form of diagonal triangle pattern. On the minor wave level the market formed wave (1). I assume that during the next several days the bears may continue pushing the price towards new minimums.
RoboForex Analytical Department
Attention!
Forecasts presented in this section only reflect the author’s private opinion and should not be considered as guidance for trading. RoboForex bears no responsibility for trading results based on trading recommendations described in these analytical reviews.