Bill Williams’ Indicators Analysis 02.09.2013 (USD/CAD, NZD/USD)
02.09.2013
Analysis for September 2nd, 2013
USD/CAD
At the H4 chart of the USD/CAD currency pair, the Alligator is moving upwards. The price is forming a new bullish fractal; AO and AC is in the red zone; there is a Squat bar on the MFI. I’m keeping my buy order; the price is expected to move upwards.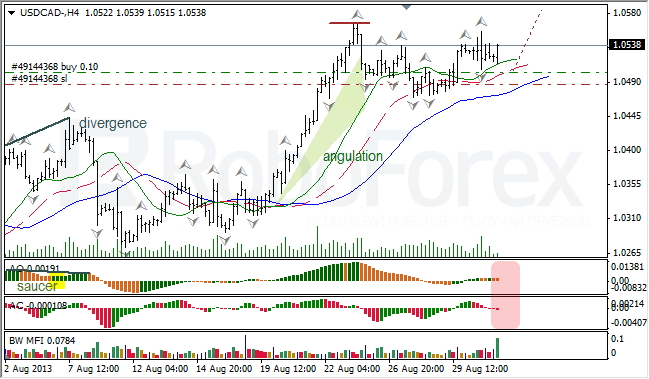
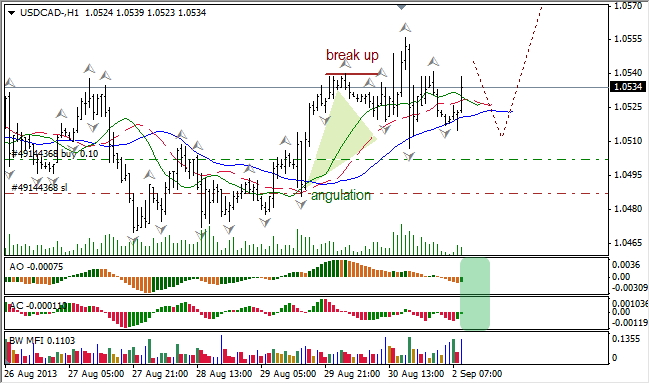
At the H1 chart of the USD/CAD currency pair, the Alligator closed its mouth. The price is forming a bullish fractal; the indicators are in the green zone; there is a Fade bar on the MFI. After the Alligator wakes up, I expect the price to move upwards.
NZD/USD
At the H4 chart of the NZD/USD currency pair, the Alligator is moving downwards. There is still a divergence with AO; the indicators are in the green zone, AC is near the balance line; there is a Squat bar on the MFI. After completing a bullish fractal, the pair is expected to move downwards.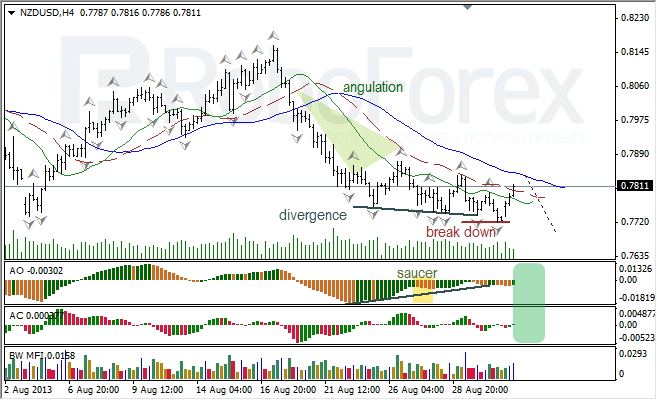
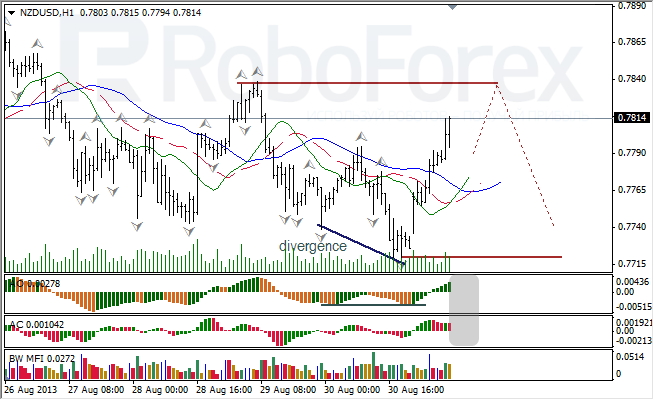
At the H1 chart of the NZD/USD currency pair, the Alligator is changing its direction and can’t go to sleep. The indicators are in the grey zone; the price is finishing a bullish fractal; there is a Green bar on the MFI. The bullish fractal is unlikely to break the red line at the top of the chart.
RoboForex Analytical Department
Attention!
Forecasts presented in this section only reflect the author’s private opinion and should not be considered as guidance for trading. RoboForex bears no responsibility for trading results based on trading recommendations described in these analytical reviews.