Forex Technical Analysis 2012/10/05 (EUR/USD, DOLLAR INDEX, GBP/USD, USD/CHF, EUR/JPY) Forecast FX
09.05.2012
Forecast for May 10th, 2012
EUR/USD
Not according to our forecast, but the EUR/USD currency pair has fallen down towards “triangle’s” lower border. However, we shouldn’t expect it fall down much from the current levels. At the H4 chart of the pair the price is forming “head & shoulders” reversal pattern at the RSI. The closest target of the growth is the area of 1.3060. One can consider buying the pair aggressively from the current levels with the stop below 1.2955. If the price reaches a new local minimum, we recommend you to stay out of the market.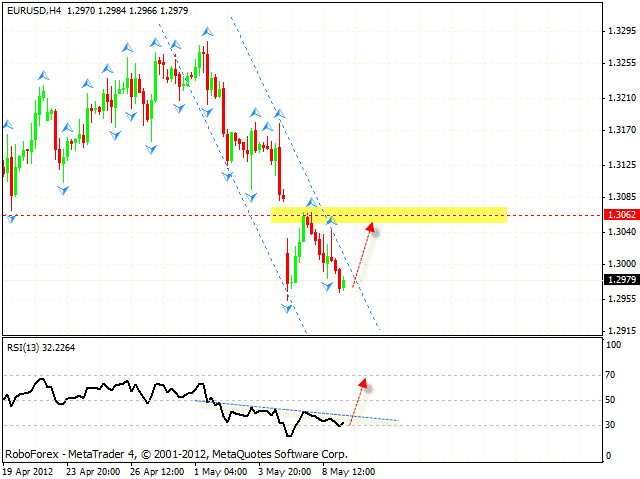
DOLLAR INDEX
The situation at the H4 chart of Dollar Index is bearish. The price is forming the descending mirror pattern with the target in the area of 77.80. The test of the trend’s descending line at the RSI is an additional signal of the fall. If Index grows up higher than 80.40, this scenario will be cancelled.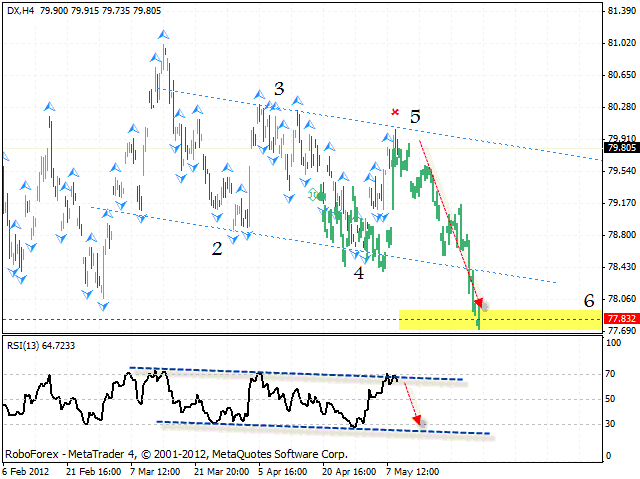
GBP/USD
The GBP/USD currency pair continues moving inside the ascending pattern. At the daily chart the RSI indicator is testing the trend’s ascending line. If the price forms reversal patterns at shorter time frames, we should expect the pair to start growing up from the current levels.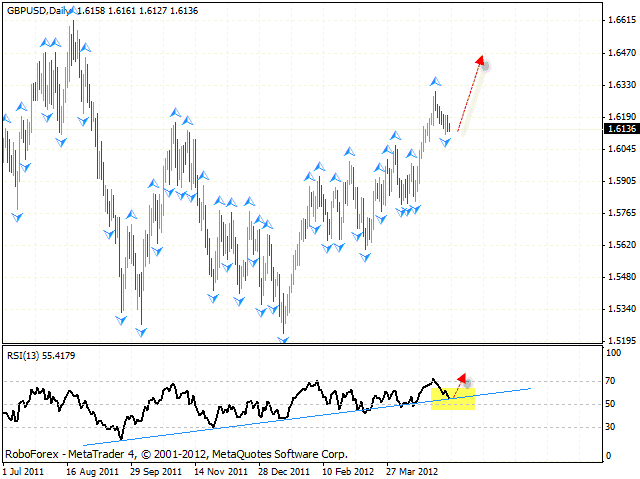
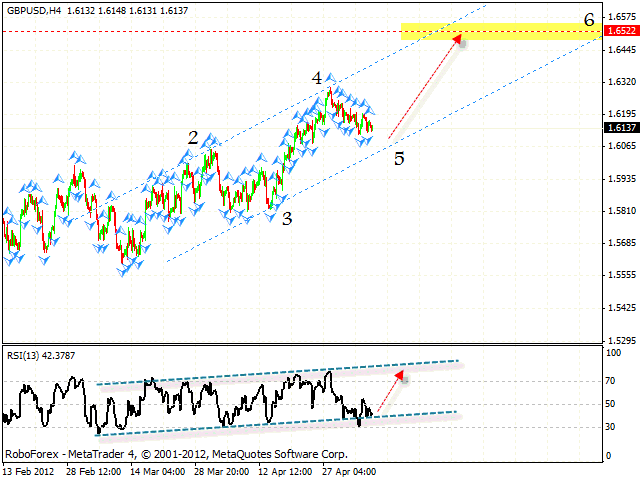
At the H4 chart the pair continues forming the mirror pattern, the target of the growth is the area of 1.6520. At the RSI there is a strong resistance level, we should expect Pound to start growing up from the current levels. Conservative traders are advised to wait until the price reaches the ascending channel’s lower border and then try to buy the pair.
USD/CHF
The USD/CHF currency pair has also grown up and broken “triangle’s” upper border. At the moment the price is moving inside a very strong resistance area near the level of 0.9300. The test of the trend’s descending line at the RSI sis an additional signal of the correction. If the price forms reversal signals at shorter time frames, we can consider selling the pair with the tight stop.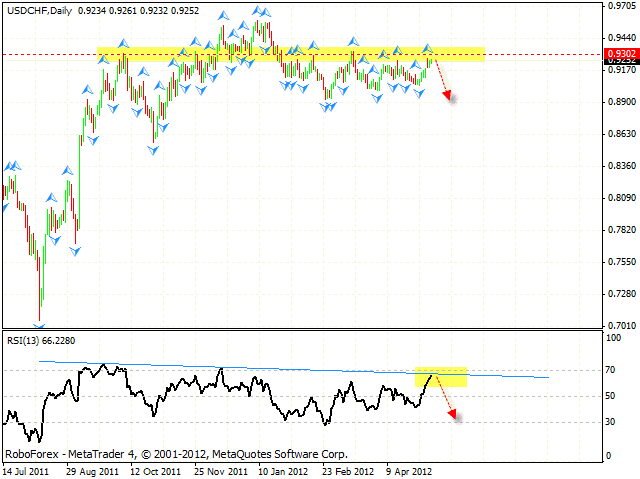
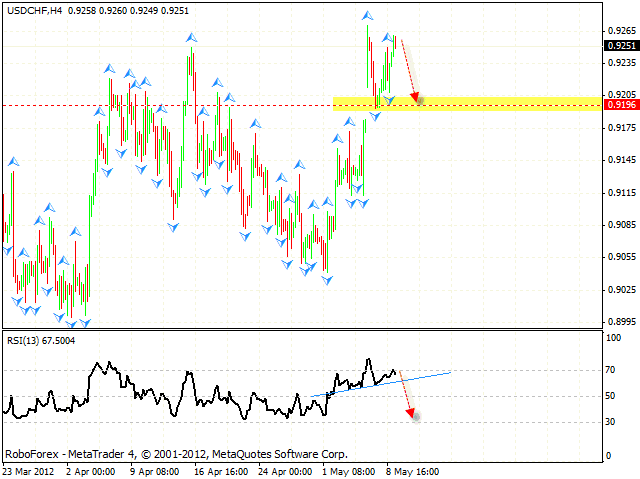
At the H4 chart the price is forming “head & shoulders” reversal pattern at the RSI. One can consider selling the pair after the price reaches a new local maximum. The closest target of the fall is the area of 0.9195.
EUR/JPY
The H4 chart of the EUR/JPY currency pair indicates that the price may start growing up towards the area of 109.70. At the moment the pair is moving inside the area for purchases, one can consider buying it aggressively from the current levels. The test of the support line at the RSI is an additional signal of the growth. If the price continues moving downwards, this scenario will be cancelled.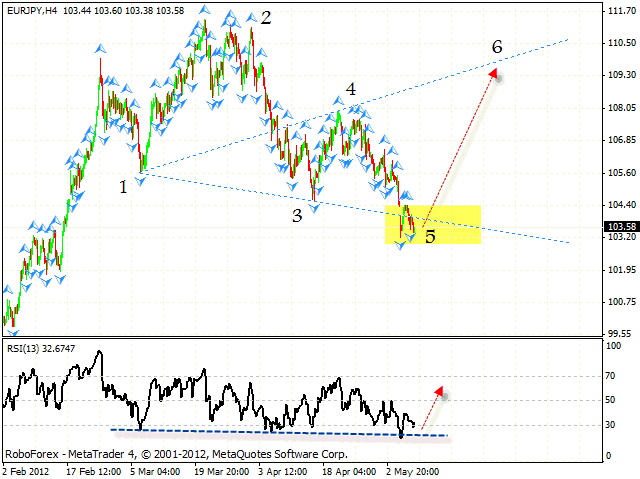
Attention!
Forecasts presented in this section only reflect the author’s private opinion and should not be considered as guidance for trading. RoboForex bears no responsibility for trading results based on trading recommendations described in these analytical reviews.